Monitoring · Network Operations
Cacti Monitoring
Network monitoring platform for NOC engineers to track device availability, interface traffic, and operational network performance.
This is an internal system, so the source code is not public. Screenshots on this page use sample data or are redacted: customer names, addresses and other internal details are removed.
Context
The NOC operates a large number of network devices and links that require continuous visibility into traffic and operational conditions. Cacti was used as part of the monitoring environment to provide historical network metrics and interface-level traffic visibility for daily operations and troubleshooting.
- Used by
- On-shift NOC engineers
- How often
- Every shift
Problem
NOC engineers needed a consistent way to inspect historical traffic and device metrics when monitoring network conditions, investigating incidents, and comparing current conditions with previous periods.
Constraints
- Limited visibility when relying only on real-time device access
- Monitoring had to work across multiple network device types
- Historical data needed to be available for operational analysis
- Monitoring had to remain simple enough for use during active incidents
Approach
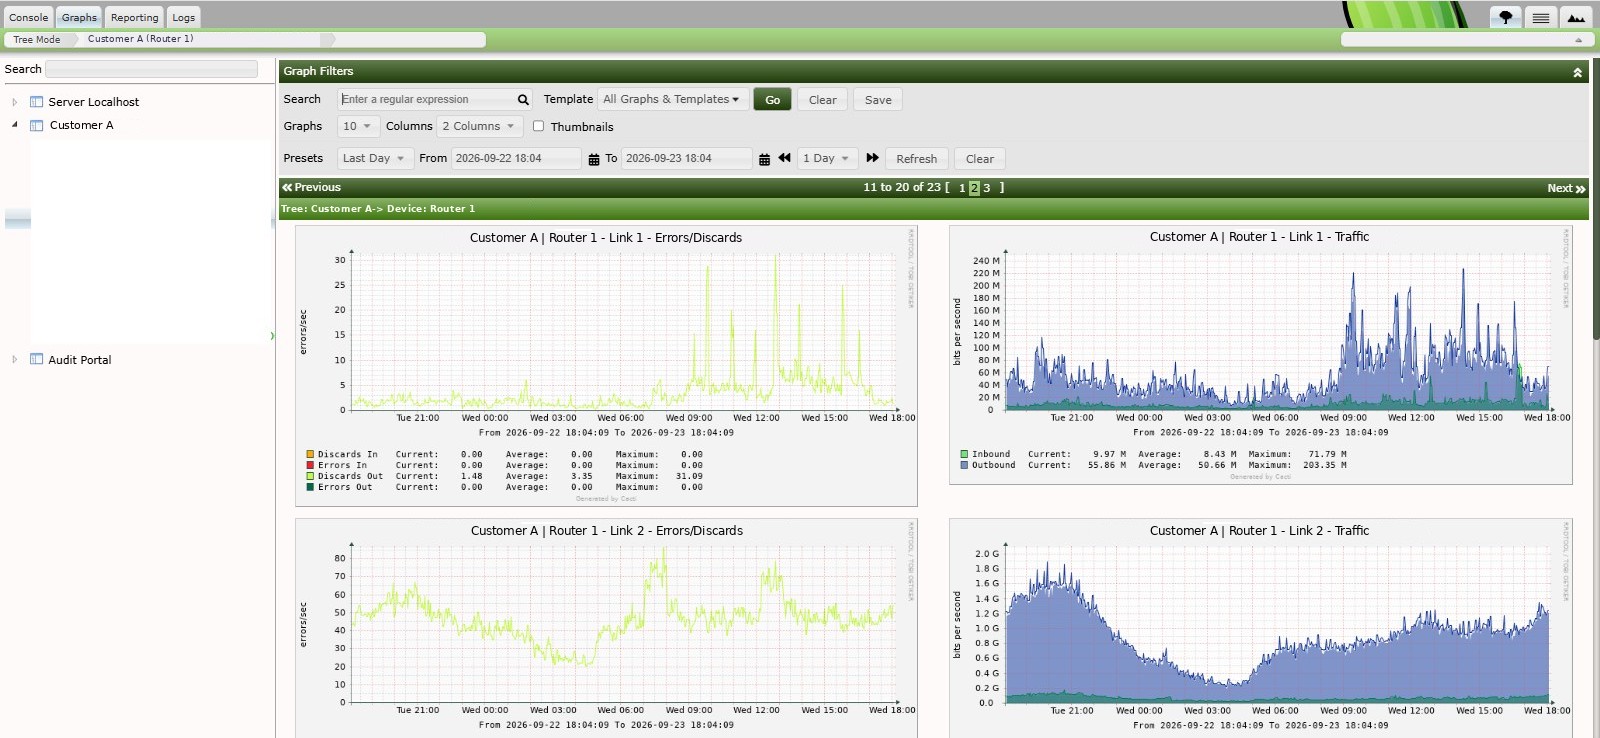
Cacti collects network performance data from monitored devices using SNMP polling and stores time-series measurements for historical visualization. Graphs are organized around devices and interfaces so NOC engineers can quickly inspect traffic patterns and operational metrics during monitoring and troubleshooting.
Key decisions & trade-offs
- Use Cacti as a dedicated historical network graphing platform.
- Cacti is well suited for long-term visualization of SNMP-based network metrics and provides a straightforward interface for NOC operational use.
- Separate traffic and operational metrics into focused monitoring views.
- Different metrics answer different troubleshooting questions, making it easier for operators to inspect the information they need during incidents.
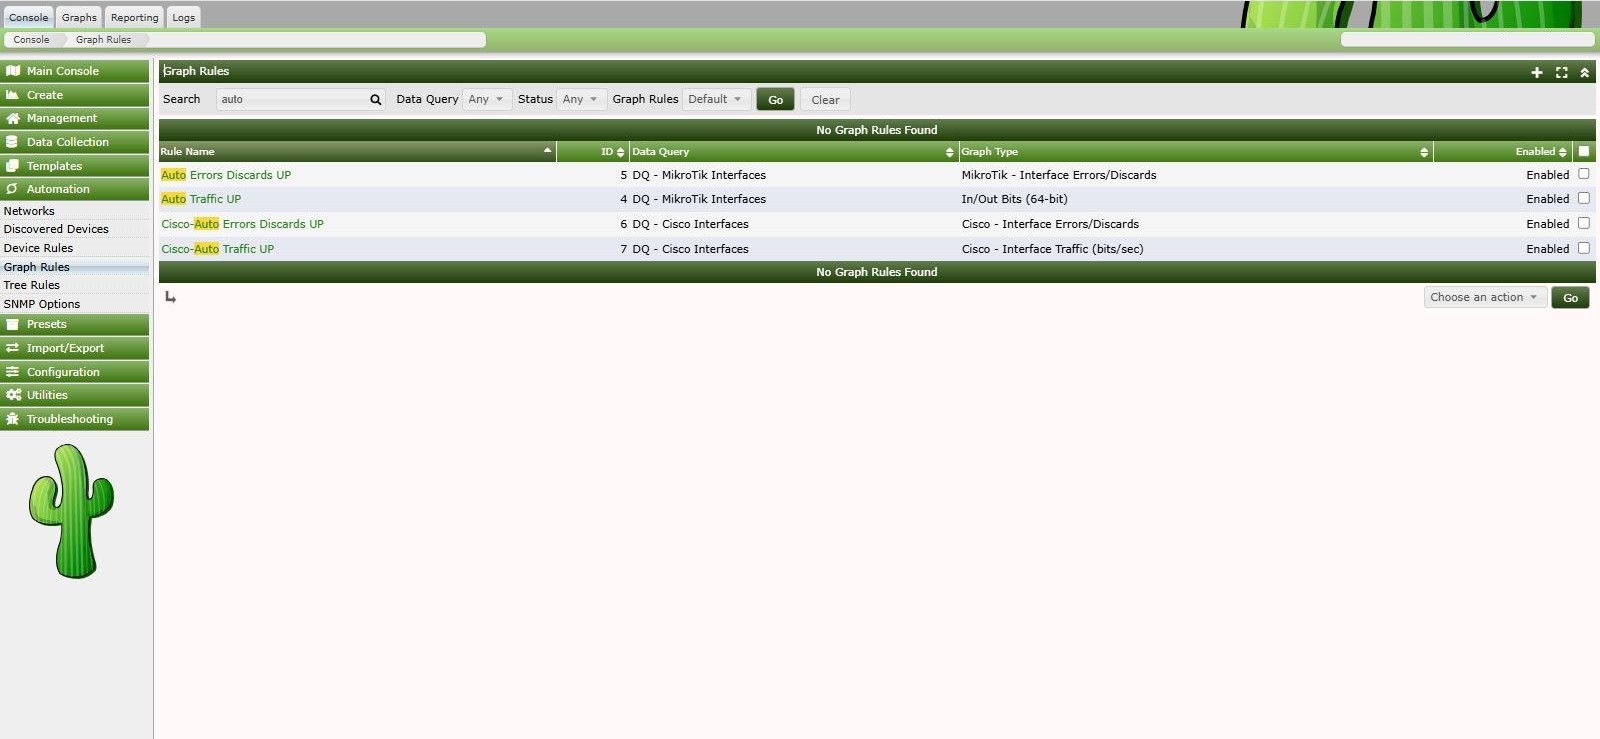
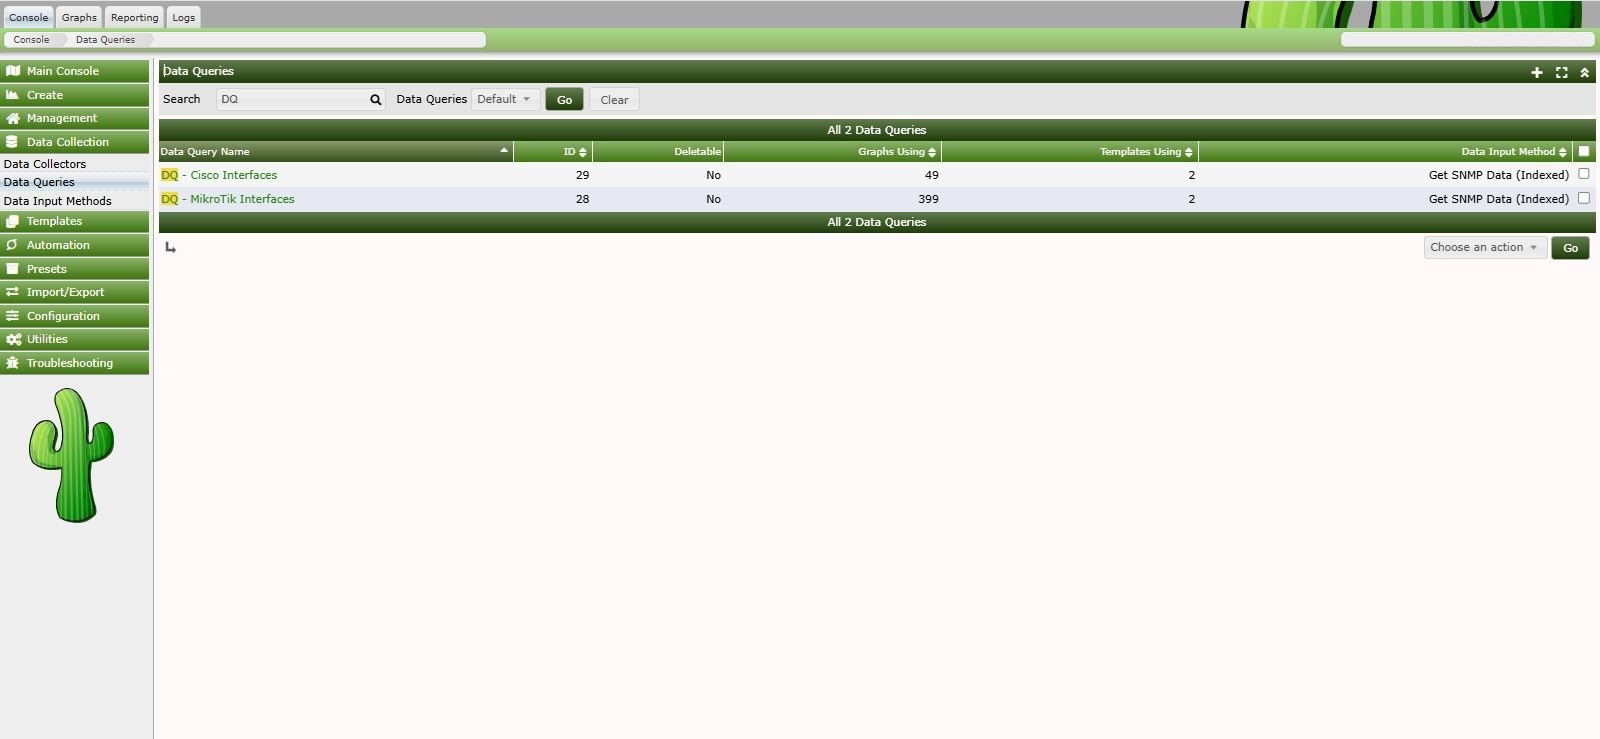
- Use reusable monitoring templates for network device interfaces.
- Templates make it easier to maintain consistent monitoring definitions across multiple devices and device models.
Trade-offs
- Primarily focused on monitoring and visualization rather than full incident management
- Historical graphs are highly useful for investigation but still require operator interpretation
- SNMP-based monitoring depends on correct device configuration and polling availability
- Cacti is one component of the wider NOC monitoring environment rather than the only monitoring system
Architecture
The platform consists of monitored network devices, SNMP polling, Cacti monitoring templates, time-series storage, and a web interface for graph visualization. Device and interface metrics are collected periodically and transformed into historical graphs that can be inspected by NOC engineers.
- Device polling Cacti periodically polls monitored network devices using SNMP.
- Metric collection Device and interface counters are collected for monitored metrics.
- Time-series storage Collected values are stored as historical monitoring data.
- Graph generation Monitoring data is presented as time-series graphs for operational analysis.
- NOC investigation NOC engineers use the graphs to inspect traffic patterns and support troubleshooting activities.
Key features
SNMP-based network monitoring
Collects operational metrics from monitored network devices through SNMP.
Interface traffic monitoring
Provides historical visibility into interface traffic and utilization patterns.
Historical graph visualization
Allows NOC engineers to review network conditions across historical time periods.
Device and interface templates
Uses reusable monitoring definitions to standardize metric collection across devices.
Operational troubleshooting support
Provides historical graphs that can be used as supporting evidence during incident investigation.
My role
Monitoring system developer · NOC operations
Designed, configured, maintained, and improved the Cacti monitoring environment used by the NOC for operational monitoring and troubleshooting.
- Designed monitoring requirements based on NOC operational needs
- Configured monitoring templates and graph definitions
- Supported onboarding of network devices into the monitoring platform
- Reviewed and improved interface and device monitoring coverage
- Investigated monitoring issues and corrected graph or polling problems
- Integrated monitoring practices into daily NOC operational workflows
Result
- Before
- Network condition analysis relied more heavily on direct device inspection and fragmented monitoring views.
- After
- NOC engineers had centralized historical graphs that could be referenced during routine monitoring and incident investigation.
Established a centralized historical monitoring capability for network devices and interfaces used by the NOC during daily monitoring and troubleshooting.
What I'd improve
- Further automate device onboarding and template deployment
- Improve monitoring standardization across different device vendors
- Add stronger correlation between Cacti graphs and incident records
- Reduce manual troubleshooting steps by integrating historical metrics with the wider NOC monitoring workflow.
Gallery